


![]() Data Trapped in Silos
Data Trapped in Silos
![]() Data Interoperability Challenges
Data Interoperability Challenges
![]() Data Quality Concerns
Data Quality Concerns
![]() Confronting Compliance Hurdles
Confronting Compliance Hurdles
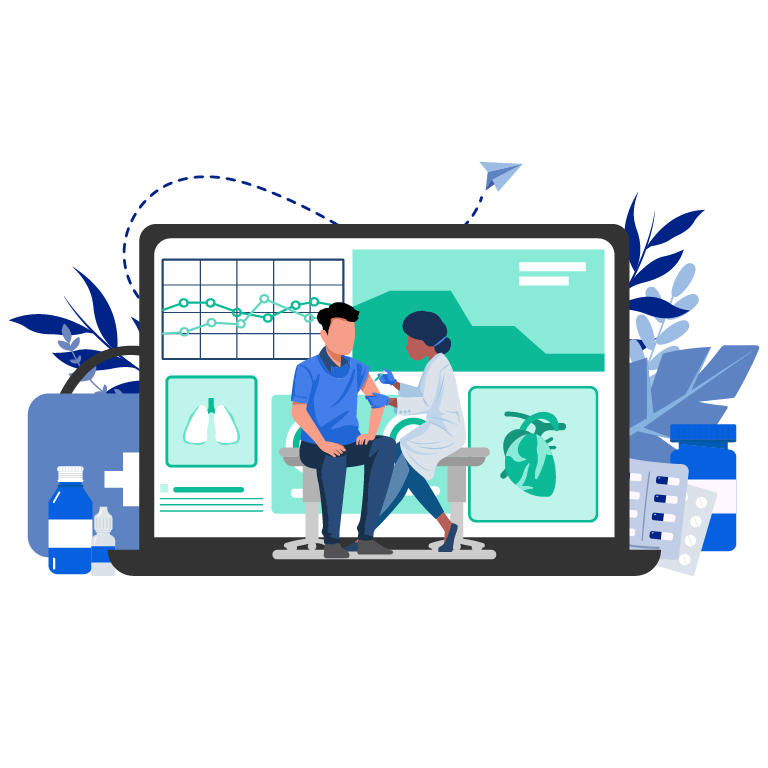
![]() Gain a comprehensive view of patient health with key metrics and trends
Gain a comprehensive view of patient health with key metrics and trends
![]() Monitor critical patient vitals in real-time for timely clinical interventions
Monitor critical patient vitals in real-time for timely clinical interventions
![]() Visualize patient journeys and health patterns with interactive dashboards
Visualize patient journeys and health patterns with interactive dashboards
![]() Analyze clinical outcomes to drive evidence-based care
Analyze clinical outcomes to drive evidence-based care
![]() Specialty-specific insights for OBGYN, Cardiovascular, Oncology, and more
Specialty-specific insights for OBGYN, Cardiovascular, Oncology, and more