Admissions Analytics
In the changing healthcare landscape, data analytics guides us in making informed choices. The VNB Admission Dashboard is a clear instance of this shift, shaping how we see healthcare. Here we’ll explore how analytics are carefully combined within the VNB Admission Dashboard, transforming key healthcare areas like patient demographics, encounter summaries, appointment trends, and operational excellence.
The dashboard includes following reports:
- Patient Demographics
- Encounter summary
- Appointment summary
- Operation metrics
Patient Demographics
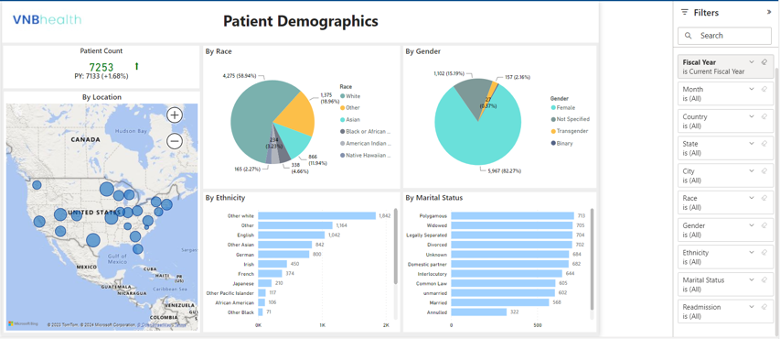
The “Patient Demographics” report offers a comprehensive view of patient characteristics. It provides insights into the current fiscal year (FY) patient count, dissected by categories such as race, gender, location, ethnicity, and marital status. By visualizing these demographics, healthcare providers can better tailor their services to meet the unique needs of their diverse patient population.
Encounter Summary
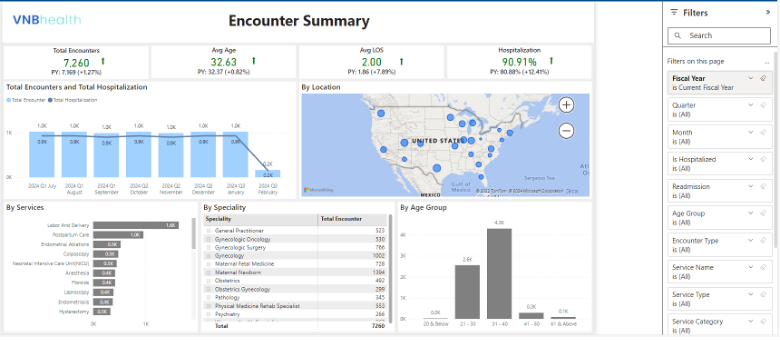
The “Encounter Summary” report delves into patient encounters, shedding light on trends and comparisons. It showcases metrics such as total encounters, average age, average length of stay, hospitalization rates, and more. Through year-on-year comparisons, healthcare professionals can identify areas of improvement and allocate resources effectively. Data visualizations help track trends across locations, services, specialties, and age groups, providing actionable insights for better decision-making.
Appointment Summary
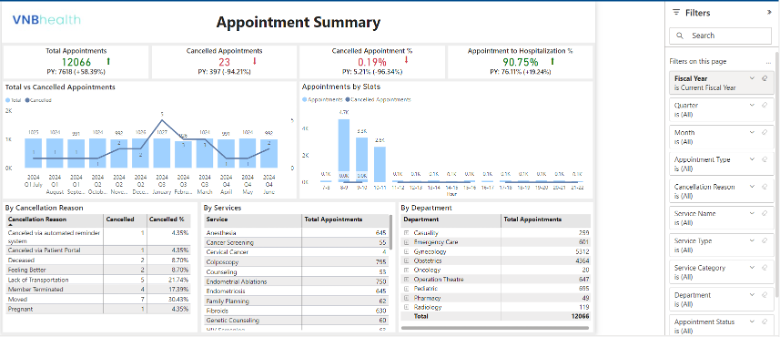
The “Appointment Summary” report takes a closer look at appointments, cancellations, and their correlations. Metrics such as total appointments, cancelled appointments, and appointment-to-hospitalization percentages are compared to the previous year’s figures. Analyzing data by cancellation reasons, services, and specialties empowers healthcare providers to identify patterns and enhance patient scheduling and engagement strategies.
Operation Metrics
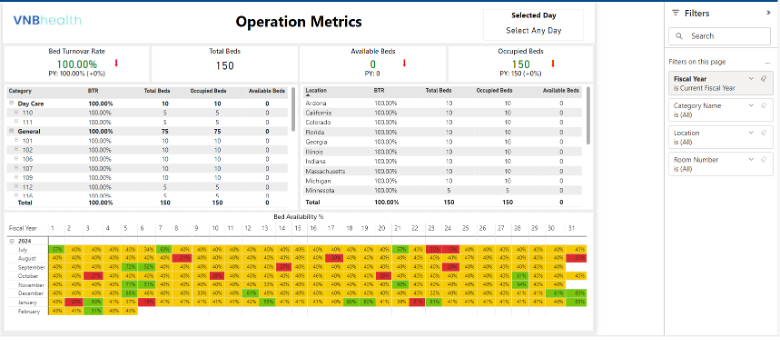
Efficient operations are critical in healthcare. The “Operation Metrics” report focuses on bed turnover rates, bed availability, and occupancy. By monitoring key metrics like bed turnover and availability percentages, healthcare institutions can optimize resource allocation and enhance patient flow. Data insights by categories such as location and bed category provide a comprehensive understanding of operational efficiency over time.
Conclusion
The VNB’s Admission Dashboard offers insights that are revolutionizing the healthcare sector’s approach to women’s healthcare. The use of analytics, visualizations, and year-on-year comparisons empowers healthcare professionals to make informed decisions, enhance patient care, and streamline operations. By harnessing the power of data, we are taking significant strides towards a future where women’s healthcare is personalized, efficient, and continuously improving.
Contact Us Today
Contact us today for a free Demo of our analytics dashboard for Admissions and discuss your future BI & Analytics initiatives with one of our expert Healthcare BI & Analytics consultants!
Recent Posts

Microsoft Fabric for Healthcare
Microsoft Fabric for Healthcare aims to transform the way healthcare is delivered, streamlining workflows, enhancing patient care, and ensuring data security and compliance.

Analyze Oncology data using Microsoft Power BI
A step-by-step guide on how to analyze your oncology data using Microsoft Power BI.

Women’s Healthcare providers leveraging Data science
VNB talks about the data science in women’s healthcare industry and how it can bring changes into healthcare analytics over the coming years.