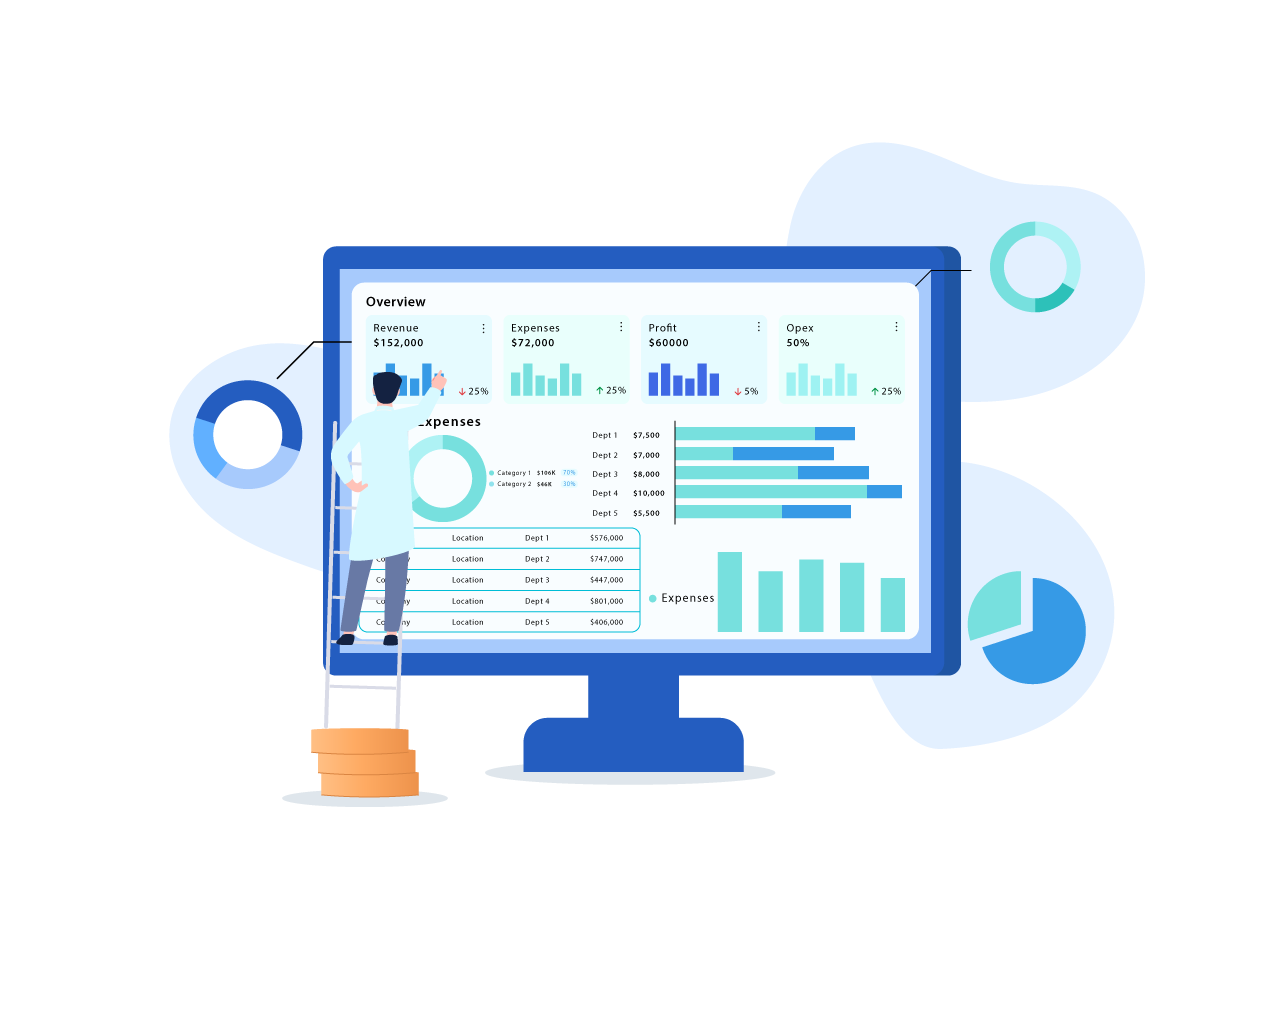


![]() Built specifically for healthcare teams with deep expertise in clinical, financial, and operational workflows
Built specifically for healthcare teams with deep expertise in clinical, financial, and operational workflows
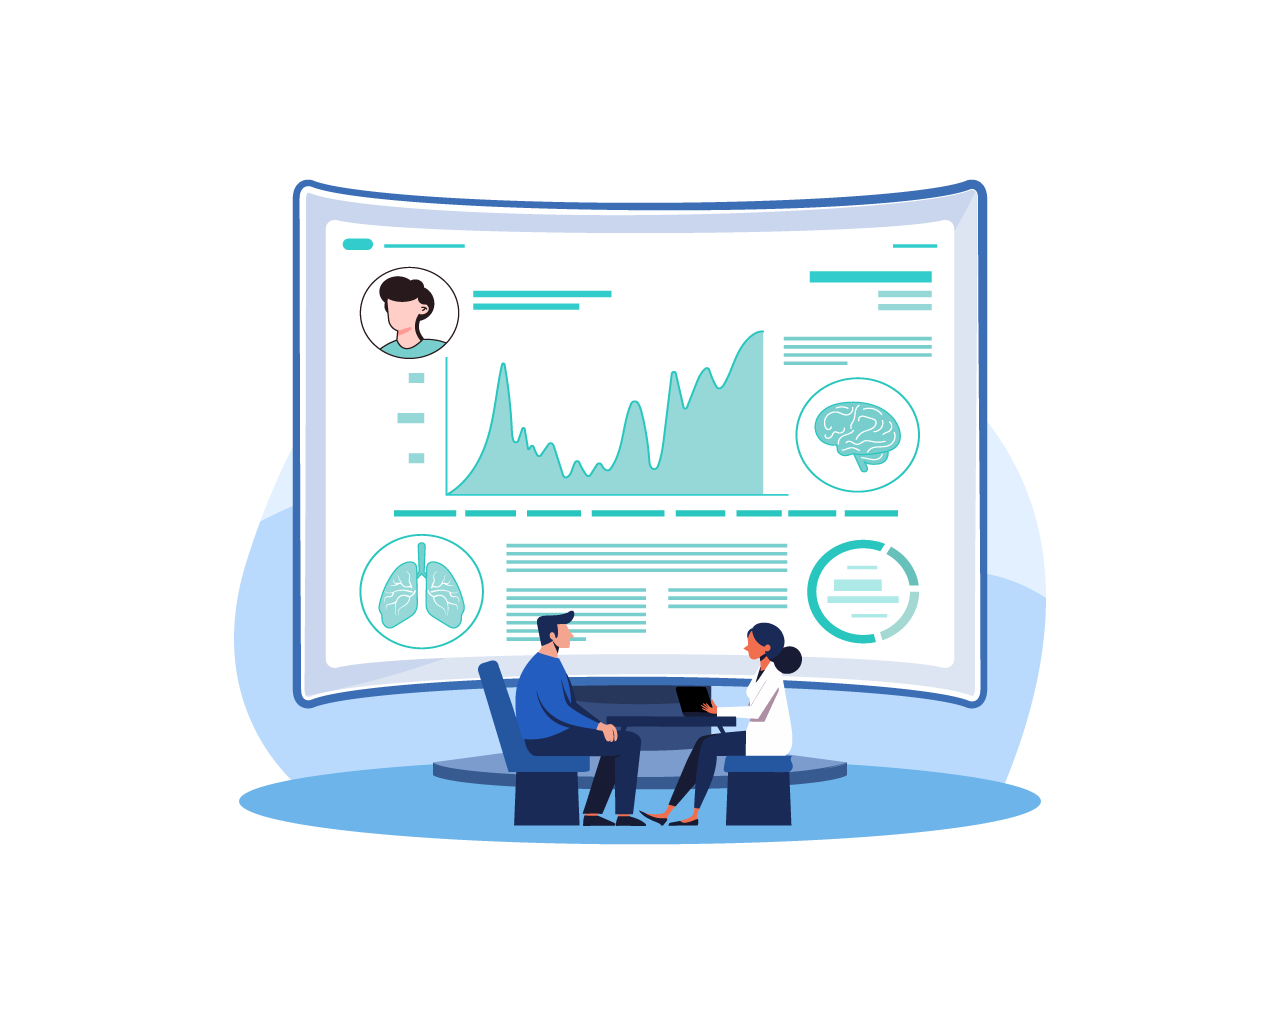
![]() Connects seamlessly with EHRs, billing systems, and other hospital data sources
Connects seamlessly with EHRs, billing systems, and other hospital data sources
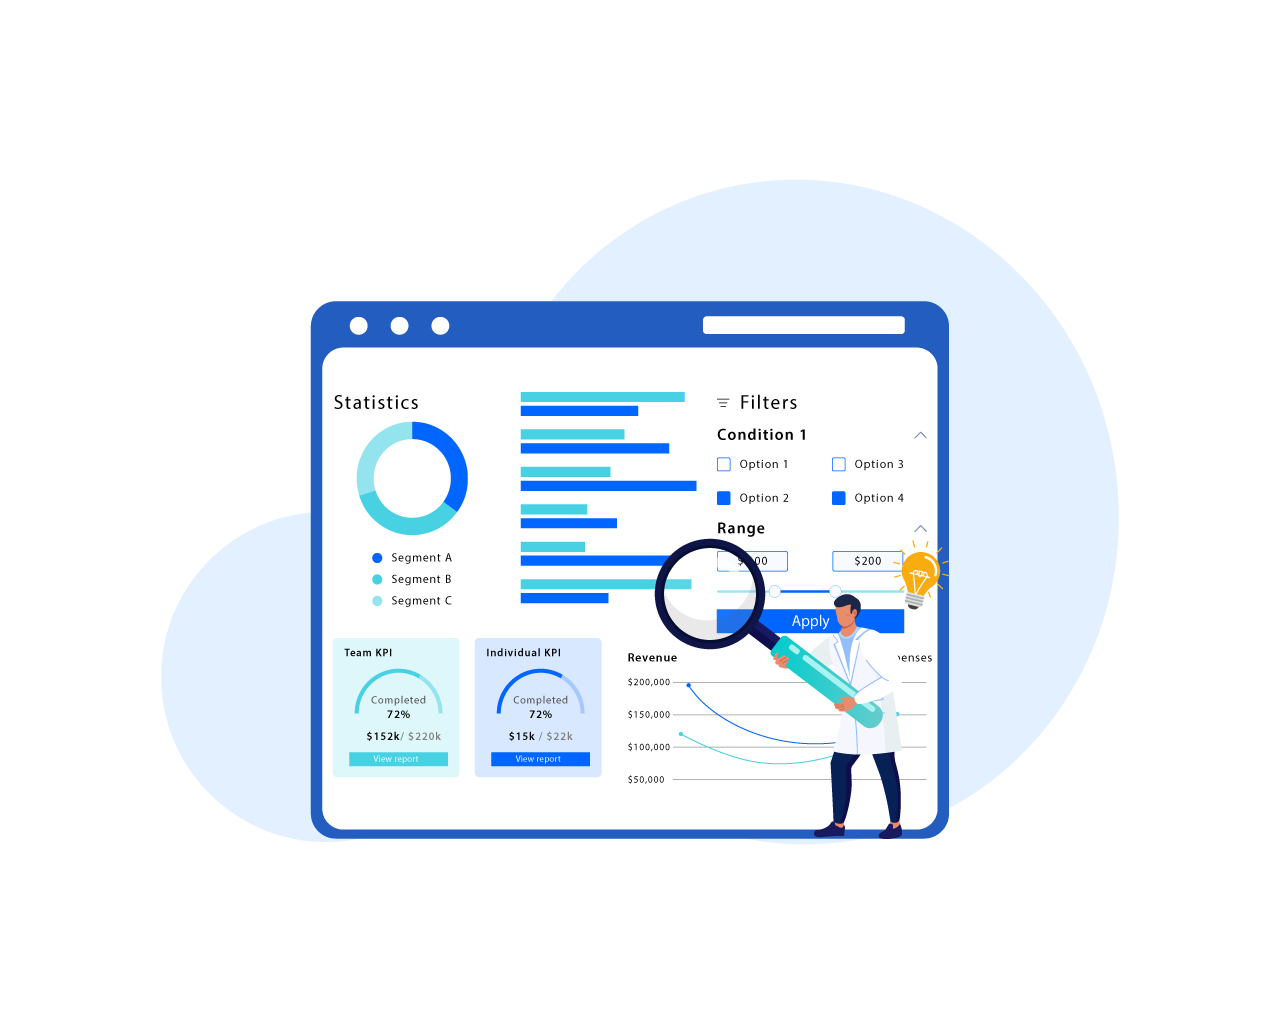
![]() AI-enhanced dashboards that keep pace with the speed of healthcare
AI-enhanced dashboards that keep pace with the speed of healthcare
![]() Keeps your data secure with HIPAA-compliant practices built into every solution
Keeps your data secure with HIPAA-compliant practices built into every solution
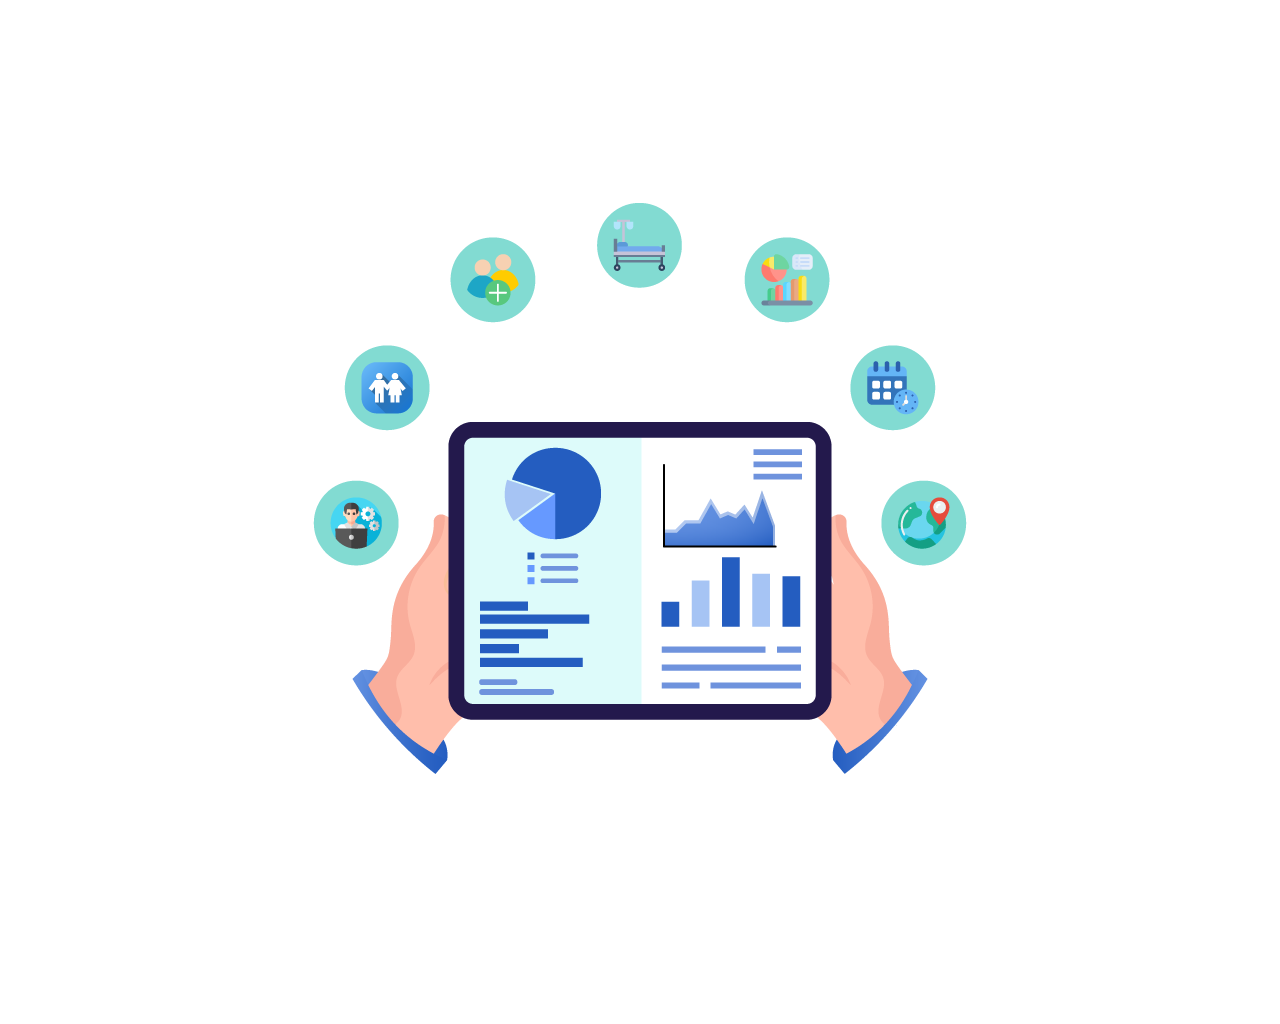
![]() Solutions shaped by real-world healthcare knowledge across workflows, regulations, and everyday challenges
Solutions shaped by real-world healthcare knowledge across workflows, regulations, and everyday challenges