Healthcare Data Solutions in Microsoft Fabric

Reimagining Healthcare Data Strategy: Microsoft Fabric and Beyond

Data is healthcare’s most valuable asset — but fragmented, incomplete, or hard-to-access data can cripple decision-making and slow down critical processes. Without timely insights, organizations struggle to improve patient care, manage costs, and maintain operational efficiency.

Enter Healthcare Data Solutions in Microsoft Fabric — a powerful platform designed to unify healthcare data, simplify reporting, and drive informed decisions.

Why Healthcare Organizations Need a New Data Strategy?

Healthcare organizations often face persistent challenges when managing data. Information is frequently scattered across multiple systems, stored in complex formats, and difficult to analyze. This fragmentation limits the ability to uncover meaningful insights — insights that could improve patient care, streamline operations, and enhance financial stability.

Healthcare Data Solutions in Microsoft Fabric addresses these issues by centralizing data from clinical, operational, and administrative systems. It breaks down silos and transforms complex data into actionable insights, helping healthcare providers unlock the full value of their information.

Understanding Microsoft’s Healthcare Data Solutions in Fabric

Understanding Microsoft Healthcare Data Solutions in Fabric

At the core of Healthcare Data Solutions in Fabric is its Lakehouse architecture — a foundation that consolidates data from multiple sources into a unified platform. This architecture streamlines ingestion, transformation, and storage, making it easier for organizations to manage and analyze data.

By integrating with Azure Health Data Services (AHDS), which supports the FHIR standard, Fabric enables the seamless ingestion of patient and operational data into a secure and centralized repository. This approach simplifies data preparation, making insights readily available for improved decision-making.

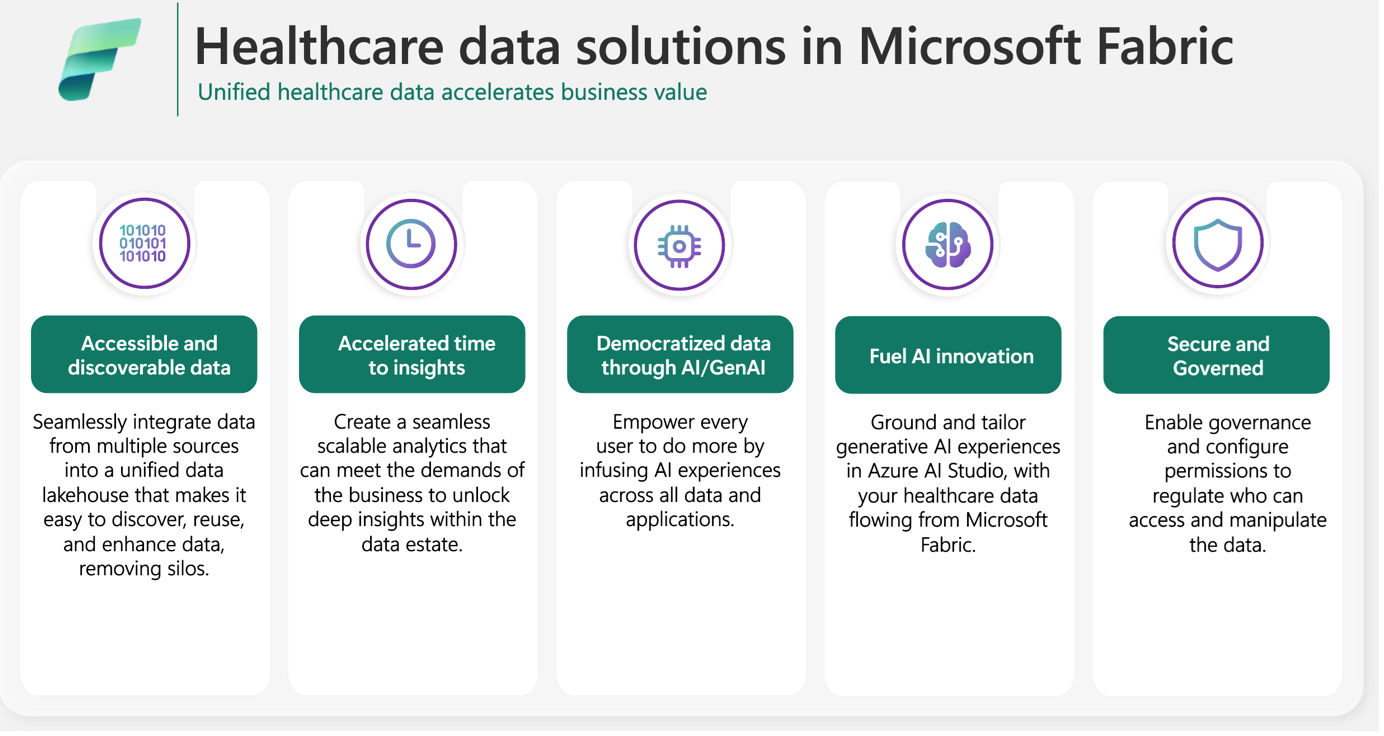
Some of the key capabilities that enable healthcare organizations to manage their data efficiently are:

Powerful Data Pipelines: Secure data ingestion and transformation through Fabric’s integration with OneLake ensures data consistency and reliability.

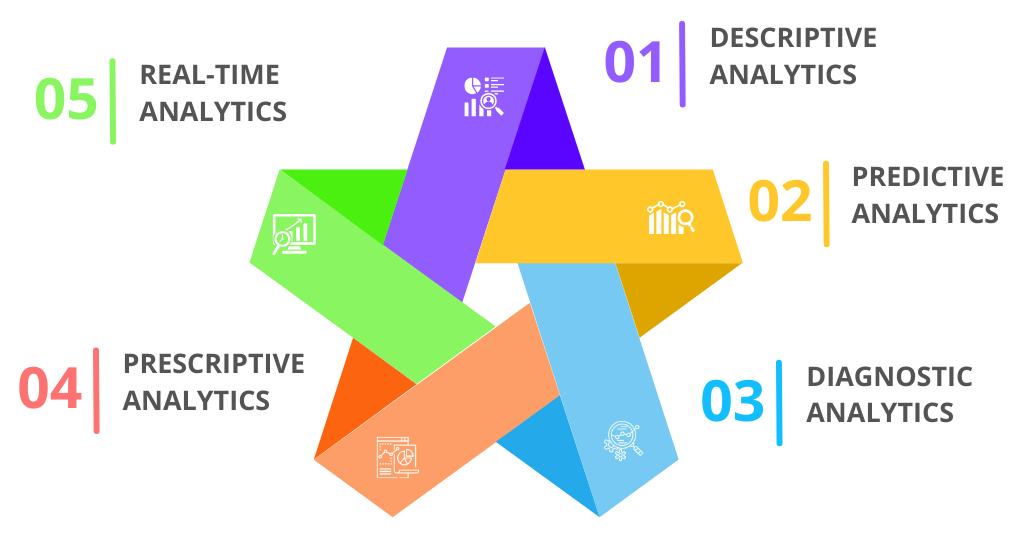
Advanced Analytics & AI Integration: Fabric enables enhanced reporting, predictive analytics, and AI-driven insights, improving clinical decision-making and operational efficiency.

Enhanced Security & Compliance: Built-in governance, role-based access control, and encryption ensure healthcare data is managed securely.

Why Microsoft Fabric Stands Out for Healthcare Providers?

The ability to unify and analyze data in a structured way creates powerful opportunities for healthcare organizations. With Healthcare Data Solutions in Fabric, healthcare providers can:

  • Track patient outcomes with greater precision
  • Streamline administrative workflows to improve operational efficiency
  • Optimize resource allocation to enhance financial performance

Microsoft Fabric stands out because of its technical strength and healthcare-specific capabilities. It integrates seamlessly with EHRs and other critical data sources, ensuring secure data exchange. Its scalability and flexibility help healthcare organizations adapt to changing needs while maintaining performance and reliability.

Whether handling large clinical datasets, financial reports, or operational insights, Fabric provides a strong foundation for healthcare data management.

Taking Healthcare Insights Further

While Microsoft Fabric provides a strong foundation for healthcare data integration, organizations often need more specialized insights tailored to their unique workflows.

This is where VNB’s Healthcare Analytics Solution takes healthcare insights to the next level.

By building on Fabric’s capabilities, our solution provides healthcare organizations with an end-to-end analytics platform designed to deliver deeper insights, improved reporting, and proactive data monitoring.

With VNB Health’s analytics solution seamlessly integrated with Microsoft Fabric, healthcare organizations can move from simply managing data to actively harnessing it — empowering data-driven decisions that improve patient outcomes, reduce costs, and enhance financial performance.

Bringing Healthcare Data to Life with Fabric & VNB Health

VNB Health’s Healthcare Analytics Solution is designed to empower healthcare organizations with deeper insights, improved reporting, and smarter decision-making.

By leveraging a robust architecture, our solution efficiently integrates data from multiple sources such as EHR systems, financial platforms, and admissions records. This seamless integration combines secure data ingestion, structured storage, and advanced analytics capabilities to deliver comprehensive insights — without adding complexity to existing systems.

Built to align seamlessly with Microsoft Fabric, our solution utilizes data pipelines for streamlined data ingestion, scalable storage solutions, and real-time data monitoring to transform raw data into actionable insights. With intuitive dashboards and dynamic reporting tools, healthcare leaders can make faster, data-driven decisions that improve operational efficiency, enhance patient care, and support financial growth.

Our comprehensive platform offers the below specialized analytics solutions to meet key healthcare challenges.

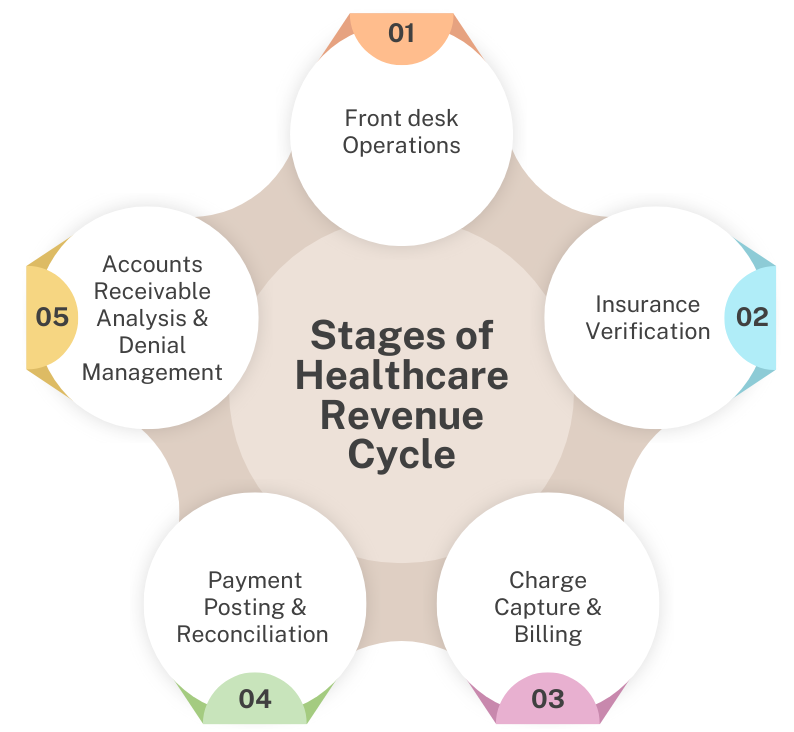
Healthcare Revenue Cycle Analytics

Boost financial stability by improving cash flow visibility and minimizing revenue leakage. Our healthcare revenue cycle analytics solution helps you track revenue cycle KPIs, identify billing inefficiencies, and close payment gaps — ensuring your bottom line stays strong.

  • Identify claim denials, billing inefficiencies, and payment gaps
  • Gain visibility into the entire billing process to improve cash flow
  • Track revenue cycle KPIs for improved financial performance

Request Demo

Healthcare Financial Analytics

Unlock financial insights to better manage expenses, improve payer performance, and predict revenue trends. Our healthcare financial analytics solution empowers healthcare leaders to make informed financial decisions that drive growth.

  • Track revenue trends, operating costs, and cash flow
  • Identify payment delays, revenue leaks, and financial risks
  • Monitor payer performance and enhance reimbursement strategies

Request Demo

Healthcare Clinical Analytics

Improve clinical outcomes by identifying high-risk patients, tracking treatment effectiveness, and predicting readmission trends. With proactive insights, your care teams can focus on what matters most — improving patient care.

  • Identify high-risk patients and predict readmission trends
  • Monitor clinical performance, treatment outcomes, and quality of care
  • Support evidence-based care decisions through proactive insights

Request Demo

Healthcare Admissions Analytics

Ensure smoother patient flow with insights into bed occupancy, discharge trends, and staffing needs. Our Admissions Analytics solution helps hospitals make smarter decisions to enhance patient experience and reduce wait times.

  • Track bed occupancy rates, patient admissions, and discharge trends
  • Optimize appointment scheduling and staffing needs
  • Enhance care coordination by identifying workflow gaps

Request Demo

Your Path to Smarter Data Management Starts Here

In healthcare, data is more than just numbers — it’s the key to improving outcomes, streamlining operations, and driving financial growth. But without the right tools to harness it, valuable insights often remain hidden. By combining Microsoft Fabric’s robust data platform with VNB Health’s Healthcare Analytics Solution, you gain an end-to-end solution designed to unlock insights that improve patient outcomes, streamline operations, and boost financial performance. Don’t let valuable insights remain hidden — take control of your healthcare data strategy today.

Whether you’re managing financial data, tracking clinical outcomes, or improving admissions processes, our solution helps you stay ahead with insights that matter. The best part? It seamlessly aligns with Microsoft Fabric, meaning you can build on an industry-leading platform while gaining enhanced reporting capabilities tailored to healthcare’s unique challenges.

Combined Power of Microsoft Fabric and VNB Health Analytics Solutions

Ready to see how VNB Health can transform your healthcare analytics journey?

Get Started Today | Book a Demo

Role of Clinical Analytics in transforming Patient Outcomes

The Role of Clinical Data Analytics in Transforming Patient Outcomes

Imagine this: a healthcare organization struggling with rising patient readmission rates and ballooning costs. Or a doctor drowning in a sea of patient data – mountains of electronic health records, discharge summaries, and lab results. While this data holds immense potential, extracting meaningful insights often feels impossible. Meanwhile, patients yearn for personalized care, yet too often receive generic treatment plans. This is the reality for many in today’s healthcare landscape. Enter Clinical Analytics – a powerful tool that empowers providers to unlock the hidden value within their data.

Redefining Care with Clinical Data Analytics

Clinical Analytics isn’t just about collecting data; it’s about transforming that data into powerful insights. By leveraging advanced techniques like AI and machine learning, healthcare businesses can uncover hidden patterns, identify patients at high risk, and even predict potential health issues.

This empowers healthcare providers to make more informed decisions, personalize treatment plans, and ultimately improve patient outcomes. Imagine having a super-powered magnifying glass that allows you to see the bigger picture and make the best decisions for your patients’ well-being – that’s the power of Clinical Analytics.

From Insight to Action: The Role of Clinical Analytics in Decision-Making

So, you now have all this incredible data available with you with some amazing insights. Now what? That’s where the real magic happens. Imagine being able to:

Predict which patients are at high risk of readmission: By analyzing crucial factors like chronic conditions and medication adherence, clinical data analytics can identify patients with a high likelihood of hospital readmission. This will enable proactive interventions from healthcare organizations such as care coordination, patient education programs to reduce readmission rates and improve patient outcomes.

Personalize Treatment Plans: No two patients are the same! With clinical analytics, healthcare organizations can tailor treatment strategies based on everyone’s needs and preferences. Analyzing specific information such as genetic, behavioral and clinical data can lead to better clinical outcomes, improved patient satisfaction, and reduced side effects.

Enhance Medical Safety: Medical errors carry significant legal, financial, and reputational risks for healthcare organizations. Clinical data analytics plays a crucial role in mitigating these risks by proactively identifying and preventing potential harm to patients. For instance, it can flag drug interactions, detect allergic reactions, personalize treatment plans, and identify other safety concerns. This allows healthcare providers to make more informed decisions, adjust treatment plans accordingly, and ultimately improve patient safety and overall care quality.

Connecting the Dots: The Challenges and Triumphs of Clinical Analytics

We’ve explored the exciting potential of clinical data analytics, but it’s important to remember that implementing any major change within a complex system like healthcare comes with its own set of hurdles. Let’s explore these and discover how healthcare organizations can overcome them to unlock the full potential of this transformative technology.

1. Breaking Down Data Silos: A Unified Vision for Patient Care

Imagine trying to build a puzzle without all the pieces. That’s often the reality for healthcare organizations grappling with fragmented data. Patient information resides in disparate systems – electronic health records (EHRs), lab results, imaging reports, and more. This data isolation hinders a comprehensive view of patient health and limits the insights that clinical analytics can provide.

To overcome this, organizations must invest in robust data integration tools and strategies such as:

  • Centralized Data Warehouses: Creating a secure and centralized repository for all patient data.
  • API Integration: Utilizing APIs to seamlessly connect different systems.
  • Data Governance: Establishing clear data governance policies to ensure data quality, accuracy, and consistency.
  • Fostering Collaboration between IT, clinical, and administrative teams to break down departmental silos and share data effectively.

2. Building Trust: Prioritizing Patient Privacy and Security

Patient data is highly sensitive. Trust is paramount, and any breach of patient privacy can have severe consequences. Implementing robust security measures is crucial to protect patient information and maintain public confidence.

To tackle this, organizations can implement the following strategies:

  • HIPAA Compliance by ensuring strict adherence to HIPAA regulations. This means regular audits to identify and address potential vulnerabilities, and a commitment to prioritizing patient privacy in all aspects of operations.
  • Advanced Encryption: Encryption isn’t a set-it-and-forget-it thing. The cyber world is constantly evolving, so organizations need to stay on top of the latest security measures. This means regularly updating encryption systems, making sure they have strong key management in place, and always looking for ways to improve defenses against cyber threats.
  • Data Access Controls: Giving people the exact access they need is key. By carefully controlling who has access to what information, businesses can minimize the risk of any accidental or intentional data breaches while still making sure the teams have the information they need to do their jobs.

3. Achieving Seamless Interoperability: Speaking the Same Language

Imagine healthcare providers speaking different languages. That’s often the reality with different systems and data formats. Lack of interoperability hinders data exchange and collaboration, hindering effective patient care.

To address this challenge:

  • Invest in interoperable solutions that act like bridges connecting different systems, allowing to easily share and access information.
  • Embrace standards like FHIR provide a common language for healthcare data, allowing different systems to “understand” each other. By adopting these standards, businesses can break down the communication barriers and ensure that patient information flows smoothly between different providers and systems.

By investing in data integration, prioritizing patient privacy, and embracing interoperability, healthcare organizations can unlock the full potential of clinical data analytics and deliver better, more informed patient care.

Unlocking the Future: Clinical Analytics Trends to Watch Out For

The future of clinical analytics is bursting with possibilities, with several emerging trends poised to revolutionize how organizations deliver healthcare.

1. AI-driven Insights: Based on studies, AI in healthcare (worldwide) was estimated at USD 19.27 billion in 2023 and is expected to reach a projected revenue of US$ 208,225.9 million by 2030. The healthcare industry’s CAGR is expected to be 37.5% from 2024 to 2030. Imagine AI sifting through mountains of data to uncover hidden patterns and predict potential health risks. Artificial intelligence and machine learning are revolutionizing clinical analytics by enabling faster, accurate diagnoses and deeper insights.

2. Real-Time Data Integration: Wearable devices and the rise of IoT are opening up a world of remote patient monitoring. Imagine a future where your health data is constantly monitored, allowing for early detection of potential problems and more proactive interventions. Wearables are set to reduce hospital costs as much as 16% by 2027 and poised to deliver global cost savings of about $200 billion in the health care sector.

3. Value-Based Care (VBC) Models: The focus is shifting from simply providing services to delivering value for patients. Clinical data analytics plays a crucial role in this shift, helping businesses understand what truly matters to patients and identify the most effective ways to improve their health. According to reports, the U.S. value-based healthcare service market size is expected to grow at a CAGR of 7.4% from 2025 to 2030. Based on data from Centers for Medicare & Medicaid Services (CMS), the VBC model has seen a 25% increase in healthcare provider participation from 2023 to 2024.

How can VNB Health help with your Clinical Analytics Needs?

We believe that data should empower organizations, not overwhelm them! Our Clinical Analytics solution empower you to unlock the full potential of your data. This data-driven approach helps to enhance patient care, optimize resource allocation and reduce costs.

We believe that data-driven healthcare is the future, and we’re committed to helping you build a brighter future for your patients. Get in touch with our experts today!

Healthcare Revenue Cycle Management (RCM) Analytics

Everything About How Revenue Cycle Management (RCM) Analytics Can Transform Healthcare Finance

In an industry where every dollar counts, are you confident that your healthcare organization is maximizing its revenue potential? With complex billing codes, evolving regulations, and a myriad of payer contracts, the healthcare revenue cycle management can be a labyrinth. Imagine a hospital or clinic as a game of chess with high stakes. Every move, every decision, can significantly impact the bottom line. A missed claim, delayed payment, or a coding error can lead to substantial financial losses. But what if there was a way to navigate this with ease?

Why is Healthcare Revenue Cycle Complicated?

The healthcare revenue cycle is like a complex puzzle with many moving pieces. It starts when a patient makes an appointment and ends only when the provider gets paid for the services rendered. Along the way, there’s a maze of steps like patient registration, insurance verification, medical coding, claim submission, and payment collection. Each step has its own set of rules and regulations, and any hiccup can delay the process, leading to lower revenue and frustrated patients. Throw in the ever-changing healthcare landscape with new regulations and technologies, and you’ve got a real challenge on your hands.

Challenges faced by Healthcare Organizations in Managing their Revenue Cycle

Healthcare organizations face numerous challenges in managing the revenue cycle. These challenges can lead to significant financial losses, operational inefficiencies, and patient dissatisfaction. Some of the key challenges are:

Revenue Cycle Analytics - Challenges

Compliance Nightmare

Navigating the complex web of healthcare regulations, such as HIPAA and other data protection laws, can be a daunting task. Staying up to date with the latest changes and ensuring compliance can be time-consuming and costly. Non-compliance can lead to hefty fines, penalties, and reputational damage.

The Coding Conundrum

Accurate coding is crucial for proper reimbursement. However, with the constant evolution of coding guidelines and the potential for human error, coding errors remain a significant challenge. Inaccurate coding can lead to claim denials, delayed payments, and reduced revenue.

Getting Paid on Time

Collecting payments in a timely manner is a persistent challenge. Factors such as slow payer reimbursements, complex billing processes, and patient responsibility can significantly impact cash flow. To optimize the payment cycle and accelerate revenue, healthcare organizations must focus on efficient claim submission, timely follow-up, and effective patient billing strategies.

Delayed Data-driven Decisions

Many healthcare organizations still rely on manual processes and outdated systems to manage their revenue cycle. This lack of data-driven insights hinders their ability to identify trends, optimize processes, and make informed decisions. By leveraging advanced analytics, organizations can gain valuable insights into their revenue cycle performance and take proactive steps to improve it.

Overall, the healthcare revenue cycle management is a complex web of processes, regulations, and payer interactions. Traditionally, organizations have relied on manual processes and reactive approaches to managing this cycle. Yet, a more proactive and intelligent approach is needed.

Power of Data & Analytics!

McKinsey studies reveal that 15% of US healthcare spending, or $400 billion annually, is wasted on inefficient revenue cycle processes like claims processing, payments, and billing. This inefficiency is largely due to outdated methods and manual processes.

Data is crucial for modern healthcare. By analyzing historical data, organizations can identify trends and patterns in claim denials, helping them improve revenue cycle efficiency and reduce losses. 

Industry experts also believe that data analytics contribute to about 5-10% of revenue increase. By analyzing large datasets, healthcare organizations can uncover hidden patterns and correlations. For example, they can identify specific claim types frequently denied due to coding errors. This insight allows them to implement targeted training and strategies to reduce future claim denials.

The Role of Predictive Analytics in Healthcare Revenue Cycle

With the advancements in AI-technology, healthcare organizations are increasingly turning to predictive analytics to gain a competitive edge. Predictive analytics involves using historical data to forecast future outcomes. In the healthcare context, this can be applied to various aspects of the revenue cycle, such as predicting claim denials, identifying high-risk patients, and forecasting future revenue. This data-driven approach helps optimize staffing, resource allocation, and overall revenue cycle efficiency.

By harnessing the power of data and predictive analytics, healthcare organizations can revolutionize their revenue cycle. As we look to the future, a data-driven approach will be essential to navigate the complexities of the healthcare landscape. This is where Revenue Cycle Analytics comes into play.

What is Revenue Cycle Analytics?

Revenue Cycle Analytics helps healthcare businesses gain valuable insights into the organization’s financial health, identify potential revenue leaks, and optimize processes for maximum efficiency. Revenue Cycle Management Analytics (RCM Analytics) is like a crystal ball that can predict future challenges and opportunities. Revenue Cycle Analytics (RCA) combines predictive and real-time analytics to forecast future trends and monitor current operations.

The Role of RCM Analytics in the Future of Healthcare Industry

Role of Revenue Cycle Analytics in Healthcare

In Healthcare, Revenue Cycle Management (RCM) Analytics is more than just a buzzword! It’s a transformative tool that’s reshaping how organizations operate and thrive.

By leveraging data-driven insights, healthcare providers can streamline their financial processes, improve patient care, and adapt to the ever-evolving healthcare landscape. But how exactly does it help your organization, and why is it so crucial for the future of healthcare?

Enhancing Financial Performance

In a healthcare environment, profit margins are often razor-thin. Revenue cycle analytics help organizations identify and address bottlenecks in the billing and payment processes. With detailed insights into denial patterns, payer trends, and payment delays, RCA ensures faster reimbursements, reduces claim denials, and optimizes revenue collection. This means improved cash flow and the ability to allocate resources more effectively.

Improving Patient Experience

Typical challenges faced by patients like billing issues and unclear payment processes put them under a lot of stress. This can damage your organization’s reputation. RCA identifies these potential areas of conflict and helps streamline the cost estimation, reduce billing errors, provide patients with transparent payment options—all contributing to a smoother healthcare journey.

Driving Operational Efficiency

Manual processes, redundant tasks, and data silos are the common causes for inefficiency in the revenue cycle. RCA automates and integrates these processes, providing a real-time view of financial performance and pinpointing areas needing improvement. Automation reduces administrative burden, freeing staff to focus on providing better patient care.

Enabling Strategic Decision Making

Having the right data is critical for healthcare organizations. Revenue cycle analytics provides actionable insights into metrics like average reimbursement rates, payer performance, and more. With these insights, organizations can make informed decisions about contract negotiations, resource allocation, and future investments.

The Road Ahead: Leveraging a Revenue Cycle Analytics Dashboard for Success

Did you know that over 90% of claim denials are preventable, yet two-thirds of denials are never resubmitted? This alarming statistic highlights the need for healthcare organizations to move beyond traditional revenue cycle practices and embrace smarter, data-driven solutions. For example, something as simple as inaccurate patient registration can snowball into billing errors, payment delays, and revenue losses.

This is where a Revenue Cycle Analytics Dashboard becomes a game-changer. By offering real-time insights and a holistic view of your revenue cycle, an analytics dashboard enables healthcare organizations to identify gaps, streamline processes, and make data-backed decisions to drive financial performance.

A well-crafted Revenue Cycle Analytics Dashboard is the key to unlocking your healthcare organization’s full potential. VNB Health’s Revenue Cycle Analytics Solution is designed to bring unparalleled visibility and actionable insights across every stage of the revenue cycle. 

Healthcare Revenue Cycle Stages

Front Desk Operations: From scheduling appointments to registering patients, we ensure a seamless and efficient patient experience.

Insurance Verification: Avoid costly claim denials with timely and precise insurance verification, ensuring eligibility and coverage are validated upfront.

Charge Capture & Billing: During the treatment phase, our solution enables healthcare organizations to meticulously capture all relevant charges, optimizing charge entry and billing for maximum revenue realization.

Payment Posting & Reconciliation: Our solution tracks incoming payments and reconciles accounts, giving you clarity on payment statuses and financial performance.

Accounts Receivable (AR) Analysis & Denial Management: By analyzing unpaid claims and identifying patterns in denials, organizations can uncover the root cause of denials, fix the problem, and get paid faster.

Wrapping Up

In this fast-paced healthcare world, efficient revenue cycle management isn’t just a nice-to-have; it’s a must-have. By leveraging the power of Revenue Cycle Analytics, healthcare organizations can revolutionize their financial health. Imagine a future where operations are streamlined, patient experiences are top-notch, and financial sustainability is guaranteed. With the right analytics solution, this future is within reach. It’s time to embrace the tools that not only conquer today’s challenges but also position your organization for a brighter, more resilient tomorrow.

Ready to transform your healthcare revenue cycle? Contact us today to explore how our RCM Analytics solution can help your organization drive efficiency, maximize revenue, and stay future-ready. Let’s build a healthier financial future together!

Healthcare Data Analytics - What, Why, Types and It's Importance

Importance of Healthcare Analytics

In today’s data-driven world, healthcare is undergoing a significant transformation. From personalized medicine to streamlined operations, the power of data analytics is revolutionizing how we approach patient care. From electronic health records (EHRs) to wearable device data, healthcare organizations are collecting more information than ever before. By analyzing this data, we can gain valuable insights that can improve patient outcomes, enhance operational efficiency, and reduce costs. In this blog, we will cover the importance of data analytics in healthcare, how data is available for healthcare organizations, the different types of health data analytics, and the power of data analytics in healthcare.

What is Healthcare Data Analytics?

Before we dive into the importance of data analytics, let’s understand what healthcare data analytics is. Healthcare analytics refers to using data to make smarter decisions in the world of medicine.

Think of healthcare analytics like this: doctors and hospitals collect tons of information – patient records, medical images, lab results, you name it! Healthcare data analytics takes all that data and crunches the numbers to spot trends, identify risks, and figure out the best course of action for each patient.

Key Data Sources for Healthcare Organizations

Healthcare organizations today sit in a goldmine of data but knowing where to find it is key. Below are some of the primary sources:

  • Electronic Health Records (EHRs) – EHRs store a wealth of patient information, including demographics, medical history, medications, diagnoses, lab results, and more.
  • Public Health Data: Data from government agencies, such as disease surveillance data, can help identify and address public health concerns.
  • Medical Imaging: X-rays, MRIs, CT scans, and other imaging data offer critical diagnostic information.
  • Health Claims Data: Insurance claims and billing data provide valuable insights into healthcare utilization, costs, and treatment patterns.
  • Patient Portals: Patient-generated data can provide valuable insights into patient experiences.

Types of Healthcare Analytics

Healthcare analytics is not a one-size-fits-all approach—there are several types of analytics that serve different purposes.

Types of Healthcare Analytics

  1. Descriptive Analytics – Focuses on examining past data to understand patterns, trends, and insights. This helps healthcare professionals track performance, monitor patient outcomes, and identify potential areas for improvement.
  2. Predictive Analytics – As the name says, it is about looking ahead! Predictive analytics leverages historical data to forecast future trends, empowering healthcare providers to anticipate potential challenges proactively. By identifying patients at high risk for specific conditions, it enables early intervention and personalized care, improving patient outcomes.
  3. Diagnostic Analytics – While Descriptive Analytics tells what happened, diagnostic analytics tells why it happened. It delves deeper into healthcare data to identify the root causes of issues or patterns.
  4. Prescriptive Analytics – Makes recommendations for the healthcare organization to take optimal decisions. It not only predicts future outcomes but also suggests the best course of action to achieve the desired results. This can help doctors and administrators make data-driven decisions about treatment plans, resource allocation, or even staff scheduling.
  5. Real-time Analytics: Processes the data as it is generated, just as the name suggests. This is particularly valuable for monitoring patient vitals, tracking the availability of critical equipment, and enables quick decision-making, improves patient care and operational efficiency.

Each type of healthcare data analytics has its own role in enhancing the healthcare system. These data-driven insights lead to more effective care, better resource utilization, and healthier patients.

The Power of Data Analytics in Healthcare

Healthcare analytics isn’t about crunching numbers; it’s about unlocking hidden patterns and insights that lead to smarter decisions. With data analytics, this future isn’t just a dream; it is becoming a reality.

Driving Better Health Outcomes

By sifting through vast amounts of patient information, we are moving beyond reactive treatments. Early disease detection, personalized care plans, and predictive insights are transforming how we prevent, diagnose, and manage health conditions. This data-driven revolution not only enhances patient outcomes but also optimizes resource allocation and improves the overall efficiency and effectiveness of the healthcare system.

Deliver Personalized Care

By analyzing a ton of information – things like your medical history, what you wear on your wrist, and more – doctors can create treatment plans that are perfect for you. This not only makes treatments work better but also enhances the whole experience. Analytics give doctors the power to make smart decisions, predict how you will react to treatments, and even adjust things on the fly. So, personalized care isn’t just a dream anymore – it’s becoming a reality that is changing how we approach healthcare.

Significant Cost Savings

Let’s face it, healthcare can get expensive. But data analytics can help healthcare businesses save money! Imagine fewer wasted medications, shorter hospital stays, and a more efficient use of the healthcare dollars. Data analytics helps to spot these inefficiencies and find smarter ways to do things to improve patient care in other areas.

Early Disease Detection and Prevention

Wouldn’t it be amazing to catch diseases before they even start causing trouble? That’s where health data analytics comes in. By analyzing massive amounts of patient data, businesses can spot patterns and trends that signal potential health risks. This allows businesses to proactively address these concerns, leading to a healthier population and a more proactive healthcare system.

Reduce Medical Errors

Medical errors can have dire consequences, but data analytics helps minimize them. By analyzing vast amounts of data, we can identify patterns and trends that may lead to errors, such as medication interactions or potential for misdiagnosis. This allows businesses to put safeguards in place, like alerts for potential drug interactions or double-checking systems to prevent mistakes. It’s like having a safety net in place to catch potential problems before they become serious issues.

How VNB can help with Health Care Data Analytics

At VNB Health, we’re all about helping your healthcare team make smart decisions with the data you already have. We know data can feel overwhelming, but with our Health Analytics Solutions, you can unlock valuable insights to steer your organization towards better decision-making, improved patient care, and overall success.

Talk to us about how our health analytics solutions can help your practice make smarter decisions with data.

Analyze Oncology data using Microsoft Power BI | VNB Health

Analyze Oncology data using Microsoft Power BI

In this blog, we talk about how analyzing oncology data with Power BI and gaining insights can aid healthcare organizations in the battle against cancer. This blog aims to provide valuable insights for business analysts looking to stay up to date on the latest trends, developments, and opportunities in the healthcare industry related to cancer diagnosis, treatment, and research.

Cancer is a significant and growing challenge for healthcare systems worldwide. According to the World Health Organization, cancer is the second leading cause of death globally, with an estimated 10 million deaths in 2020 alone. This represents a significant burden on healthcare systems and presents an opportunity for businesses to develop innovative solutions to address this challenge.

Business Intelligence (BI) involves the use of data analytics tools and techniques to gather, analyze, and present data to support business decision-making. Below are some ways healthcare organizations can analyze Oncology Data with Power BI and the different details that can be visualized through the reports.

Data Analysis using recent trends of Power BI

Power BI is a business intelligence and data visualization tool that enables users to connect to various data sources, create interactive reports and dashboards, and share them with others. It is a powerful tool for analyzing big datasets and gaining insights that can aid in decision- making. Power BI has grown in popularity in the healthcare sector in recent years, where it is used to analyze patient data, clinical trials, and other healthcare-related data.

Identify cancer metrics: BI tools can be used to analyze cancer data from various sources such as electronic health records (EHR), insurance claims, and public health data to identify the prevalence and incidence rates of different types of cancer. This information can help businesses identify market opportunities related to cancer diagnosis and treatment.

Here’a an overview of how data is collected, cleaned, transformed and can be represented in visuals.

Data Collection

The first step in using Power BI to analyze cancer is to gather data. Power BI includes the ability to connect to various data sources. We will use the National Cancer Institute’s Surveillance, Epidemiology, and End Results (SEER) Program dataset, which contains information on cancer cases . The dataset includes information on patient demographics, cancer type, stage at diagnosis, treatment, and survival.

Data Cleansing

The next step is to clean the data after it has been loaded into Power BI. Data cleaning entails removing missing values, duplicates, and any other errors found in the data.

Data Modeling

After importing the data into Power BI, we will create a data model. In the data model, we will create relationships between tables and define measures and calculated columns. Measures are calculations that aggregate data, such as the number of cancer cases or the average age at diagnosis.

Calculated columns are columns that are created using a formula, such as calculating the BMI of a patient based on their height and weight.

Data Visualizations

We can now create various visualizations using the data model. One of the recent updates in Power BI is the introduction of smart narratives. Smart narratives allow us to add narratives to our visualizations automatically. We can use this feature to add descriptions to our charts and tables, explaining what the data means and why it is important.

For example, we can create a stacked column chart that shows the number of cancer cases by cancer type and stage at diagnosis. We can add a smart narrative that explains that the chart shows the distribution of cancer cases by cancer type and stage, and that the chart can be used to identify the most common cancer types and stages at diagnosis.

Analyzing Cancer Measures

Analyzing cancer is essential for several reasons:

  • Understand cancer prevalence and incidence: Analyzing cancer helps us understand the prevalence and incidence rates of different types of cancer. This information is crucial for developing effective cancer prevention and control strategies, identifying high-risk populations, and allocating healthcare resources to address the burden of cancer
  • Identify risk factors and causes: Analyzing cancer data can help us identify risk factors and causes of different types of cancer. This information can help us develop effective cancer prevention strategies and reduce the incidence of cancer.
  • Develop effective cancer treatments: Analyzing cancer data can help us understand the biology and behavior of different types of cancer. This information is critical for developing effective cancer treatments that target specific types of cancer cells and minimize harm to healthy cells.
  • Monitor cancer trends and outcomes: Analyzing cancer data over time can help us monitor cancer trends and outcomes. This information can help us identify changes in cancer incidence and mortality rates, evaluate the effectiveness of cancer prevention and treatment programs, and inform healthcare policy decisions.
  • Improve cancer patient care: Analyzing cancer data can help us improve cancer patient care by identifying gaps in care, developing evidence-based treatment guidelines, and improving cancer patient outcomes.

Here are a few trends to analyze Oncology Data with Power BI more efficiently.

Analyze Survival Rate using Sparkline

Survival rate: This refers to the proportion of people diagnosed with cancer who are still alive after a specified period. Survival rates can help assess the effectiveness of cancer treatments and can be used to identify areas for improvement in cancer care. Sparklines are used  to show trends in a series of values, such as increases or decreases or to highlight max and min values.

To analyze the trends of cancer survival rate – 

  • Create a table or matrix.
  • Select the dropdown arrow next to one of the numeric fields, and select Add a sparkline


  • In the dialog box, configure the details of your sparkline. The numeric field you started with is pre-populated for the Y-axis. You can change field and Summarization type, if needed. You also need to select a field, typically a date field, to use as the X-axis of the sparkline.


  • Select Create. The sparkline is automatically added to your table or matrix as a new column.


  • Select the dropdown arrow next to sparkline and select Edit sparkline.         


  • In the Sparklines card in the Format pane, modify the sparkline line and marker formatting. Change the line color and width, add markers for different value types (highest, first, last, and so on), and change the marker size, color, and shape.

Visualize Cancer Mortality Rates using Line Charts

Mortality rate: This refers to the number of deaths caused by cancer in a population over a specified period. Mortality rates can help assess the impact of cancer on a population and can be used to identify disparities in cancer outcomes among different demographic groups.

The best indicator of progress against cancer is a change in age-adjusted mortality (death) rates, although other measures, such as quality of life, are also important.

To observe the changes, line charts are used and with the new feature format a visual on object, we can cross highlight and cross filter by right clicking on the visual.

To analyze the mortality rate measures, in a few cases we have overlapping data elements. Power BI takes the best guess at our selection. If we want to modify it, right-click and use the dropdown menu to change your selection to the element you’d like to format.

Visibility of Prevalence of Cancer by Age

Prevalence is defined as the number or percent of people alive on a certain date in a population who previously had a diagnosis of the disease.

Information on prevalence can be used for health planning, resource allocation, and an estimate of cancer survivorship. Power BI is providing a new feature to show the data underlying the visual to view the data in the form of a table along with the visual.

For this:

  • Use Visual table to display the data underlying a visual. Visual table is available from the Data/Drill tab in the ribbon when a visual is selected.


  • When you select Visual table or Data point table, Power BI displays both the visual and the textual representation of the data. In the horizontal view, the visual is displayed on the top half of the canvas, and the data is shown on the bottom half.


  • To get back to the report, select < Back to Report in the upper-left corner of the canvas.


Analyze Cancer Cases using Small Multiples

With this growing global burden, prevention of cancer is one of the most significant public health challenges of the 21st century. For this it is essential to explore which countries have the highest cancer cases of different types. For this:

  • Create small multiples on column chart and drag the country field into the small multiples in the fields section of Build visual pane.


  • Analyze number of cases of different types of cancer across countries. So, change the layout dimensions accordingly.


  • Number of cases by types of cancer and country is analysed as shown below –

AI Insights within Power BI

Machine learning and artificial intelligence (AI) are also playing an increasingly important role in cancer analysis. These technologies can analyze large amounts of data and identify patterns that might not be immediately apparent to human researchers. This can help accelerate the development of new cancer treatments and improve the accuracy of cancer diagnoses.

AI Insights in Power BI can also be used to analyze metrics of cancer.

Apply Insights in Power BI to explain Incidence Rate of Breast Cancer

Often in visuals, you see a large increase and then a sharp drop in values and wonder about the cause of such fluctuations. To use insights to explain increases or decreases seen on charts, just right-click on any data point in a bar or line chart and select Analyze > Explain the increase or decrease.

Power BI then runs its machine learning algorithms over the data and populates a window with a visual and a description that describes which categories most influenced the increase or decrease. By default, insights are provided as a waterfall visual, as shown in the following image.

Wrapping Up

Microsoft Power BI is an important tool for anyone working in the healthcare industry due to its ability to connect to various data sources, create interactive reports and dashboards, and safeguard confidential data. By analyzing oncology data with Power BI, we can gain insights that will help us better comprehend the disease, develop new treatments, and, eventually, save lives.

VNB Health Solutions is a Healthcare Analytics services provider with expertise in data governance, data integration, data warehousing, data science and data visualizations. Please connect with us to learn more about our Healthcare Analytics services.