
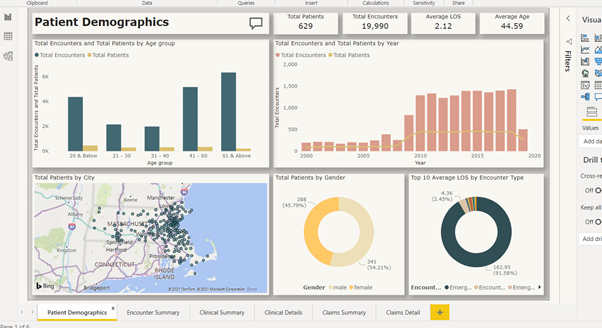
In this blog, we will show how to use the Power BI FHIR connector to connect Power BI to a FHIR server and create Power BI dashboard. Power BI FHIR Dashboards are built using Power BI connector for FHIR with focus on Patient, Clinical and Claims resources of FHIR.
- Patients – Patient demographic distribution, patient encounters, patient LOS and related information
- Clinical – Active and resolved conditions, distribution of patients to conditions, distribution of observation category to encounters etc.
- Claims – Distribution of claims value to Insurer, to city, by age, by claim type etc.
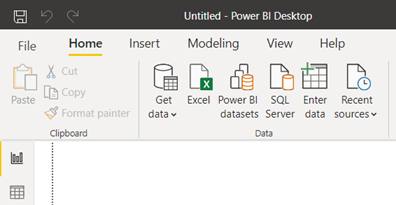
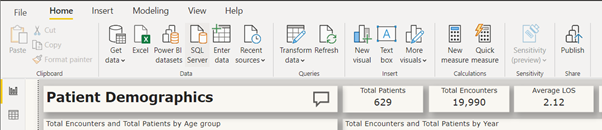
- Open Power BI Desktop
- Click on Get data
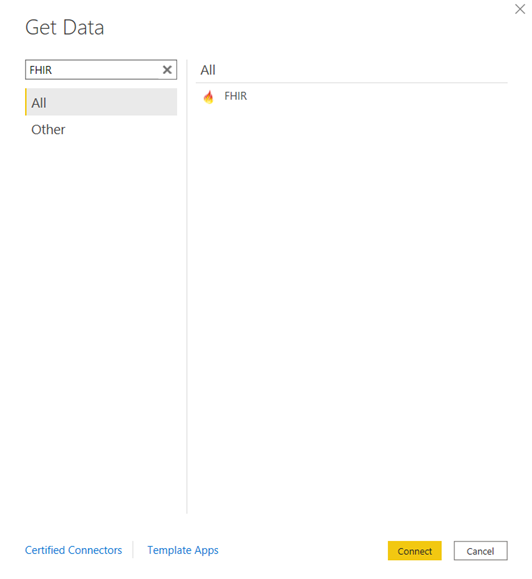
- In the Get Data window, type and search ‘FHIR’. Select ‘FHIR’ shown under ‘All’ and click Connect at the bottom.
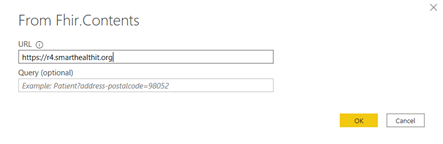
- Another window will open. Enter the following URL – ‘https://r4.smarthealthit.org/’, which has data related to FHIR entities. Click OK.
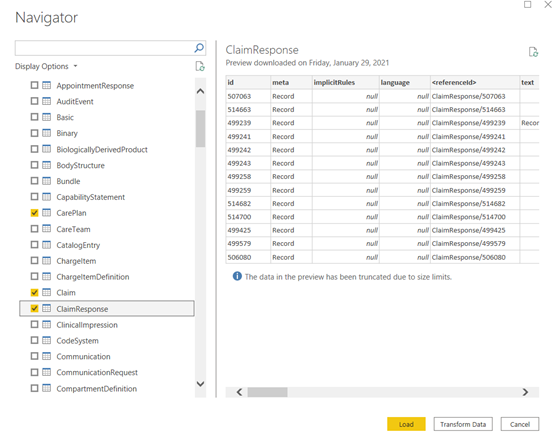
- If asked for authentication, make sure ‘Anonymous’ is selected and then click ‘Connect’. On successful connection, a ‘Navigator’ window will come up.
- Select required tables from the list of tables on the left and Click ‘Transform Data’
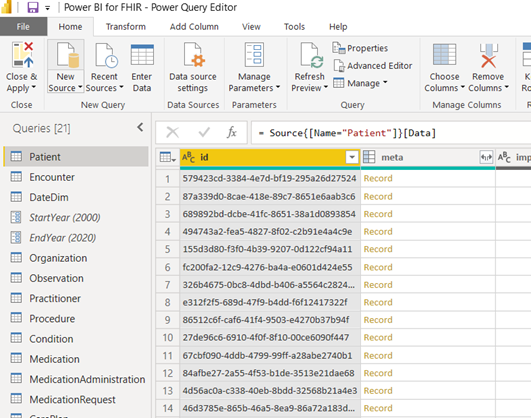
- Power Query Editor Window will open. Here we have to do all the cleaning up (expanding hierarchy, renaming columns etc.) of data.
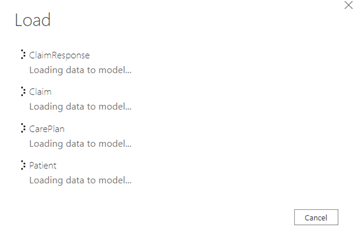
- Click on ‘Close & Apply’. Another window will pop up showing data load for all the tables.
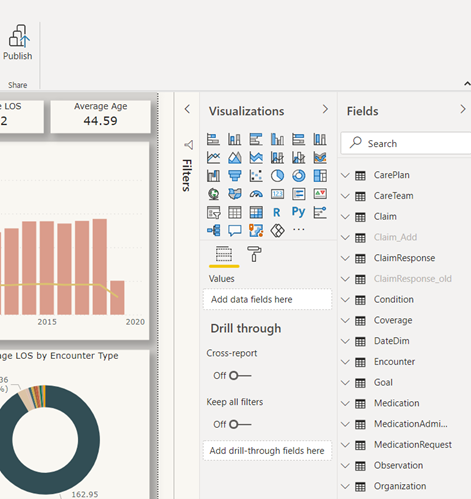
- In the report tab, under ‘Field’, all the tables loaded and transformed will be listed.
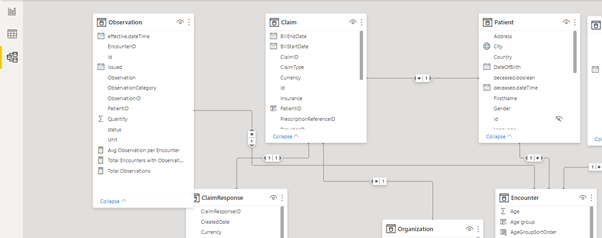
- Click on Model tab, create relationship between tables using the ‘drag and connect’ feature for related columns.
- Once the relationship among all the table are defined, next step is to create required visuals for each report.
- Click Publish to Publish the report to the desired workspace.
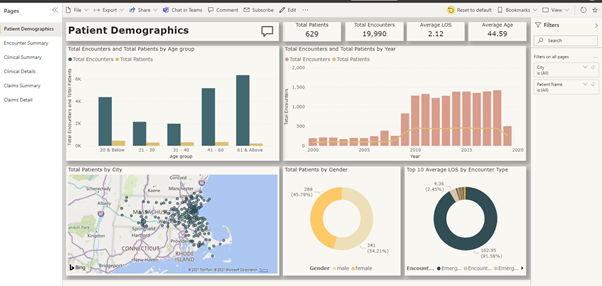
- Once published to desired workspace, report is available for users to explore in Power BI Service
For any assistance with building Power BI reports and dashboard on FHIR repository, please contact us by filling out our Contact form.